
The foreclosure filings for Big Bear (notices of default, notices of trustee sale, and properties that went back to the bank) in April 2009 were down 5% as compared to March 2009. But, they were up 20% when compared to April 2008, or year over year.
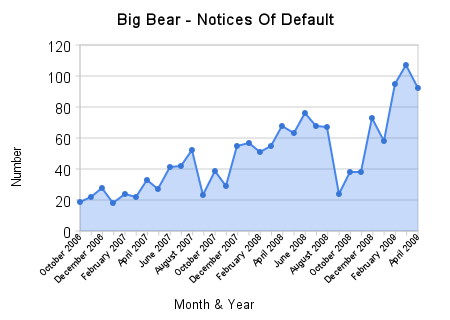
There were a total of 92 properties in the Big Bear area that received a notice of default in April, which is down 14% from the all-time high we saw in March 2009. Even though there was a decline, 92 is still on the very high end of the range (see the chart below) and does not mean things are getting better. Notices of Default are the first step in the foreclosure process.
Compared to the default numbers of April 2008, the notices of default are up 35%!
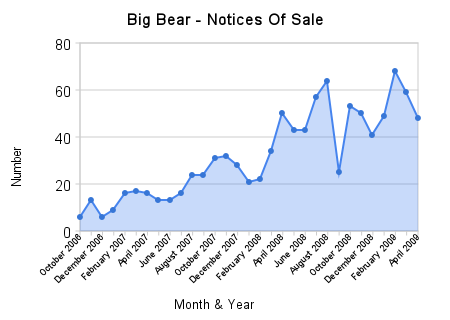
Notices of Trustee Sale (NTS), which sets an auction date & time, continued their decline for the second straight month. When compared to the increasing default numbers, this appears to be further evidence that some banks are holding off setting a sale date for their properties as they try to work something out with the current mortgagor/owner.
Even after the bank files a notice of sale, they are postponing that sale date several times from what I’ve noticed. It is not uncommon for the bank to postpone the sale date 2-3 months.
These postponements and delays by the banks slow the process down, which in turn skews the real estate market numbers. It is tough to get an accurate feel for the market when it is being tinkered with by the banks & government.
In total, NTSs were down 19% in April when compared March, and 4% from the same month last year.
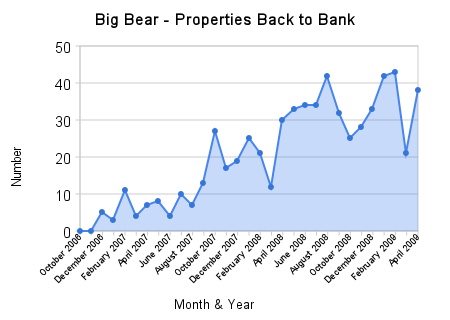
The number of properties that went back to the bank was the only number that actually went up in April, up nearly 80 from the March number.
Keep in mind that 43 is the highest we have seen so far. After a lull in March, it seems that bank owned properties in Big Bear will continue to come on the market through the remainder of the year. That is not great news for those looking for a market bottom.
Year over year, the number of properties that went back to the bank in April was up 26% from that same month last year.
Here are the monthly foreclosure numbers broken down by each area in Big Bear –
92315 = Big Bear Lake, which is made of Big Bear Lake West (the Boulder Bay area), Big Bear Lake Central (the area around the Village), Big Bear Lake East (Eagle Point area, Summit Estates), most of the Fox Farm area (including Castle Glen, Eagle Mountain, Alpine Woods, and others), & most of the Moonridge area.
92314 = Big Bear City, which includes Erwin Lake, Lake Williams, Baldwin Lake, Whispering Forest, and small parts on Moonridge & Fox Farm.
92386 = Sugarloaf.
92333 = Fawnskin area of the North Shore.
Notices of Default
| Month/Yr. | 92315 | 92314 | 92386 | 92333 | Total |
|---|---|---|---|---|---|
| Apr. 09 | 42 | 36 | 1 | 13 | 92 |
| Mar. 09 | 31 | 49 | 22 | 5 | 107 |
| Feb. 09 | 30 | 54 | 9 | 2 | 95 |
| Jan. 09 | 19 | 32 | 6 | 1 | 58 |
| Dec. 08 | 18 | 38 | 15 | 2 | 73 |
| Nov. 08 | 21 | 14 | 3 | 0 | 38 |
| Oct. 08 | 11 | 17 | 7 | 3 | 38 |
| Sept. 08 | 13 | 8 | 2 | 1 | 24 |
| Aug. 08 | 24 | 29 | 14 | 0 | 67 |
| Jul. 08 | 25 | 33 | 10 | 0 | 68 |
| Jun. 08 | 27 | 35 | 14 | 0 | 76 |
| May 08 | 20 | 31 | 11 | 1 | 63 |
| Apr. 08 | 20 | 30 | 16 | 2 | 68 |
| Mar. 08 | 21 | 21 | 11 | 2 | 55 |
| Feb. 08 | 17 | 23 | 10 | 1 | 51 |
| Jan. 08 | 17 | 28 | 9 | 3 | 57 |
| Dec. 07 | 16 | 28 | 8 | 3 | 55 |
| Nov. 07 | 14 | 12 | 3 | 0 | 29 |
| Oct. 07 | 8 | 23 | 6 | 2 | 39 |
| Sept. 07 | 4 | 15 | 4 | 0 | 23 |
| Aug. 07 | 16 | 29 | 6 | 1 | 52 |
| Jul. 07 | 15 | 18 | 8 | 1 | 42 |
| Jun. 07 | 9 | 26 | 5 | 1 | 41 |
| May 07 | 13 | 11 | 5 | 0 | 27 |
| Apr. 07 | 12 | 15 | 5 | 1 | 33 |
| Mar. 07 | 4 | 12 | 5 | 1 | 22 |
| Feb. 07 | 5 | 12 | 7 | 0 | 24 |
| Jan. 07 | 4 | 11 | 3 | 0 | 18 |
| Dec. 06 | 7 | 14 | 7 | 0 | 28 |
| Nov. 06 | 6 | 14 | 2 | 0 | 22 |
| Oct. 06 | 8 | 7 | 3 | 1 | 19 |
Notices Of Sale
| Month/Yr. | 92315 | 92314 | 92386 | 92333 | Total |
|---|---|---|---|---|---|
| Apr. 09 | 12 | 26 | 2 | 8 | 48 |
| Mar. 09 | 17 | 30 | 11 | 1 | 59 |
| Feb. 09 | 20 | 23 | 5 | 0 | 68 |
| Jan. 09 | 20 | 17 | 10 | 2 | 49 |
| Dec. 08 | 15 | 19 | 7 | 0 | 41 |
| Nov. 08 | 22 | 22 | 6 | 0 | 50 |
| Oct. 08 | 18 | 24 | 11 | 0 | 53 |
| Sept. 08 | 10 | 11 | 4 | 0 | 25 |
| Aug. 08 | 23 | 30 | 11 | 0 | 64 |
| Jul. 08 | 11 | 27 | 16 | 3 | 57 |
| Jun. 08 | 16 | 18 | 9 | 0 | 43 |
| May 08 | 11 | 21 | 9 | 3 | 44 |
| Apr. 08 | 16 | 23 | 10 | 1 | 50 |
| Mar. 08 | 8 | 19 | 6 | 1 | 34 |
| Feb. 08 | 6 | 10 | 6 | 0 | 22 |
| Jan. 08 | 7 | 11 | 3 | 0 | 21 |
| Dec. 07 | 8 | 16 | 3 | 1 | 28 |
| Nov. 07 | 9 | 18 | 5 | 0 | 32 |
| Oct. 07 | 9 | 15 | 6 | 1 | 31 |
| Sept. 07 | 6 | 16 | 2 | 0 | 24 |
| Aug. 07 | 9 | 9 | 6 | 0 | 24 |
| Jul. 07 | 3 | 6 | 6 | 1 | 16 |
| Jun. 07 | 3 | 7 | 2 | 1 | 13 |
| May 07 | 5 | 6 | 2 | 0 | 13 |
| Apr. 07 | 3 | 10 | 3 | 0 | 16 |
| Mar. 07 | 3 | 11 | 3 | 0 | 17 |
| Feb. 07 | 5 | 9 | 2 | 0 | 16 |
| Jan. 07 | 5 | 2 | 1 | 1 | 9 |
| Dec. 06 | 0 | 5 | 1 | 0 | 6 |
| Nov. 06 | 6 | 5 | 2 | 0 | 13 |
| Oct. 06 | 3 | 2 | 1 | 0 | 6 |
Properties Back To The Bank
| Month/Yr. | 92315 | 92314 | 92386 | 92333 | Total |
|---|---|---|---|---|---|
| Apr. 09 | 15 | 19 | 1 | 3 | 38 |
| Mar. 09 | 10 | 7 | 4 | 0 | 21 |
| Feb. 09 | 14 | 18 | 11 | 0 | 43 |
| Jan. 09 | 8 | 17 | 17 | 0 | 42 |
| Dec. 08 | 14 | 14 | 5 | 0 | 33 |
| Nov. 08 | 9 | 14 | 5 | 0 | 28 |
| Oct. 08 | 10 | 12 | 3 | 0 | 25 |
| Sept. 08 | 10 | 18 | 4 | 0 | 32 |
| Aug. 08 | 8 | 17 | 14 | 3 | 42 |
| Jul. 08 | 13 | 14 | 6 | 1 | 34 |
| Jun. 08 | 13 | 12 | 8 | 1 | 34 |
| May 08 | 9 | 16 | 7 | 1 | 33 |
| Apr. 08 | 7 | 16 | 6 | 1 | 30 |
| Mar. 08 | 2 | 7 | 5 | 0 | 12 |
| Feb. 08 | 9 | 7 | 4 | 1 | 21 |
| Jan. 08 | 3 | 18 | 4 | 0 | 25 |
| Dec. 07 | 7 | 10 | 2 | 0 | 19 |
| Nov. 07 | 4 | 8 | 4 | 1 | 17 |
| Oct. 07 | 9 | 16 | 2 | 0 | 27 |
| Sept. 07 | 4 | 5 | 4 | 0 | 13 |
| Aug. 07 | 0 | 6 | 1 | 0 | 7 |
| Jul. 07 | 2 | 5 | 3 | 0 | 10 |
| Jun. 07 | 0 | 3 | 1 | 0 | 4 |
| May 07 | 2 | 4 | 2 | 0 | 8 |
| Apr. 07 | 1 | 4 | 2 | 0 | 7 |
| Mar. 07 | 1 | 3 | 0 | 0 | 4 |
| Feb. 07 | 3 | 6 | 2 | 0 | 11 |
| Jan. 07 | 0 | 3 | 0 | 0 | 3 |
| Dec. 06 | 1 | 2 | 2 | 0 | 5 |
| Nov. 06 | 0 | 0 | 0 | 0 | 0 |
| Oct. 06 | 0 | 0 | 0 | 0 | 0 |
Related Articles
March 2009 – Foreclosure Numbers For The Big Bear Real Estate Market
Big Bear Real Estate Market – Monthly Foreclosure Numbers February 2009


Speak Your Mind